I wrote a Prometheus plugin for OctoPrint
Purpose
After doing the environmental monitoring project, I wanted an easy way to be able to correlate environmental changes with 3D printing. I also wanted a way to keep track of my prints, amount of filament used, etc. I wanted the ability to drill down on specific days and specific prints.
An example
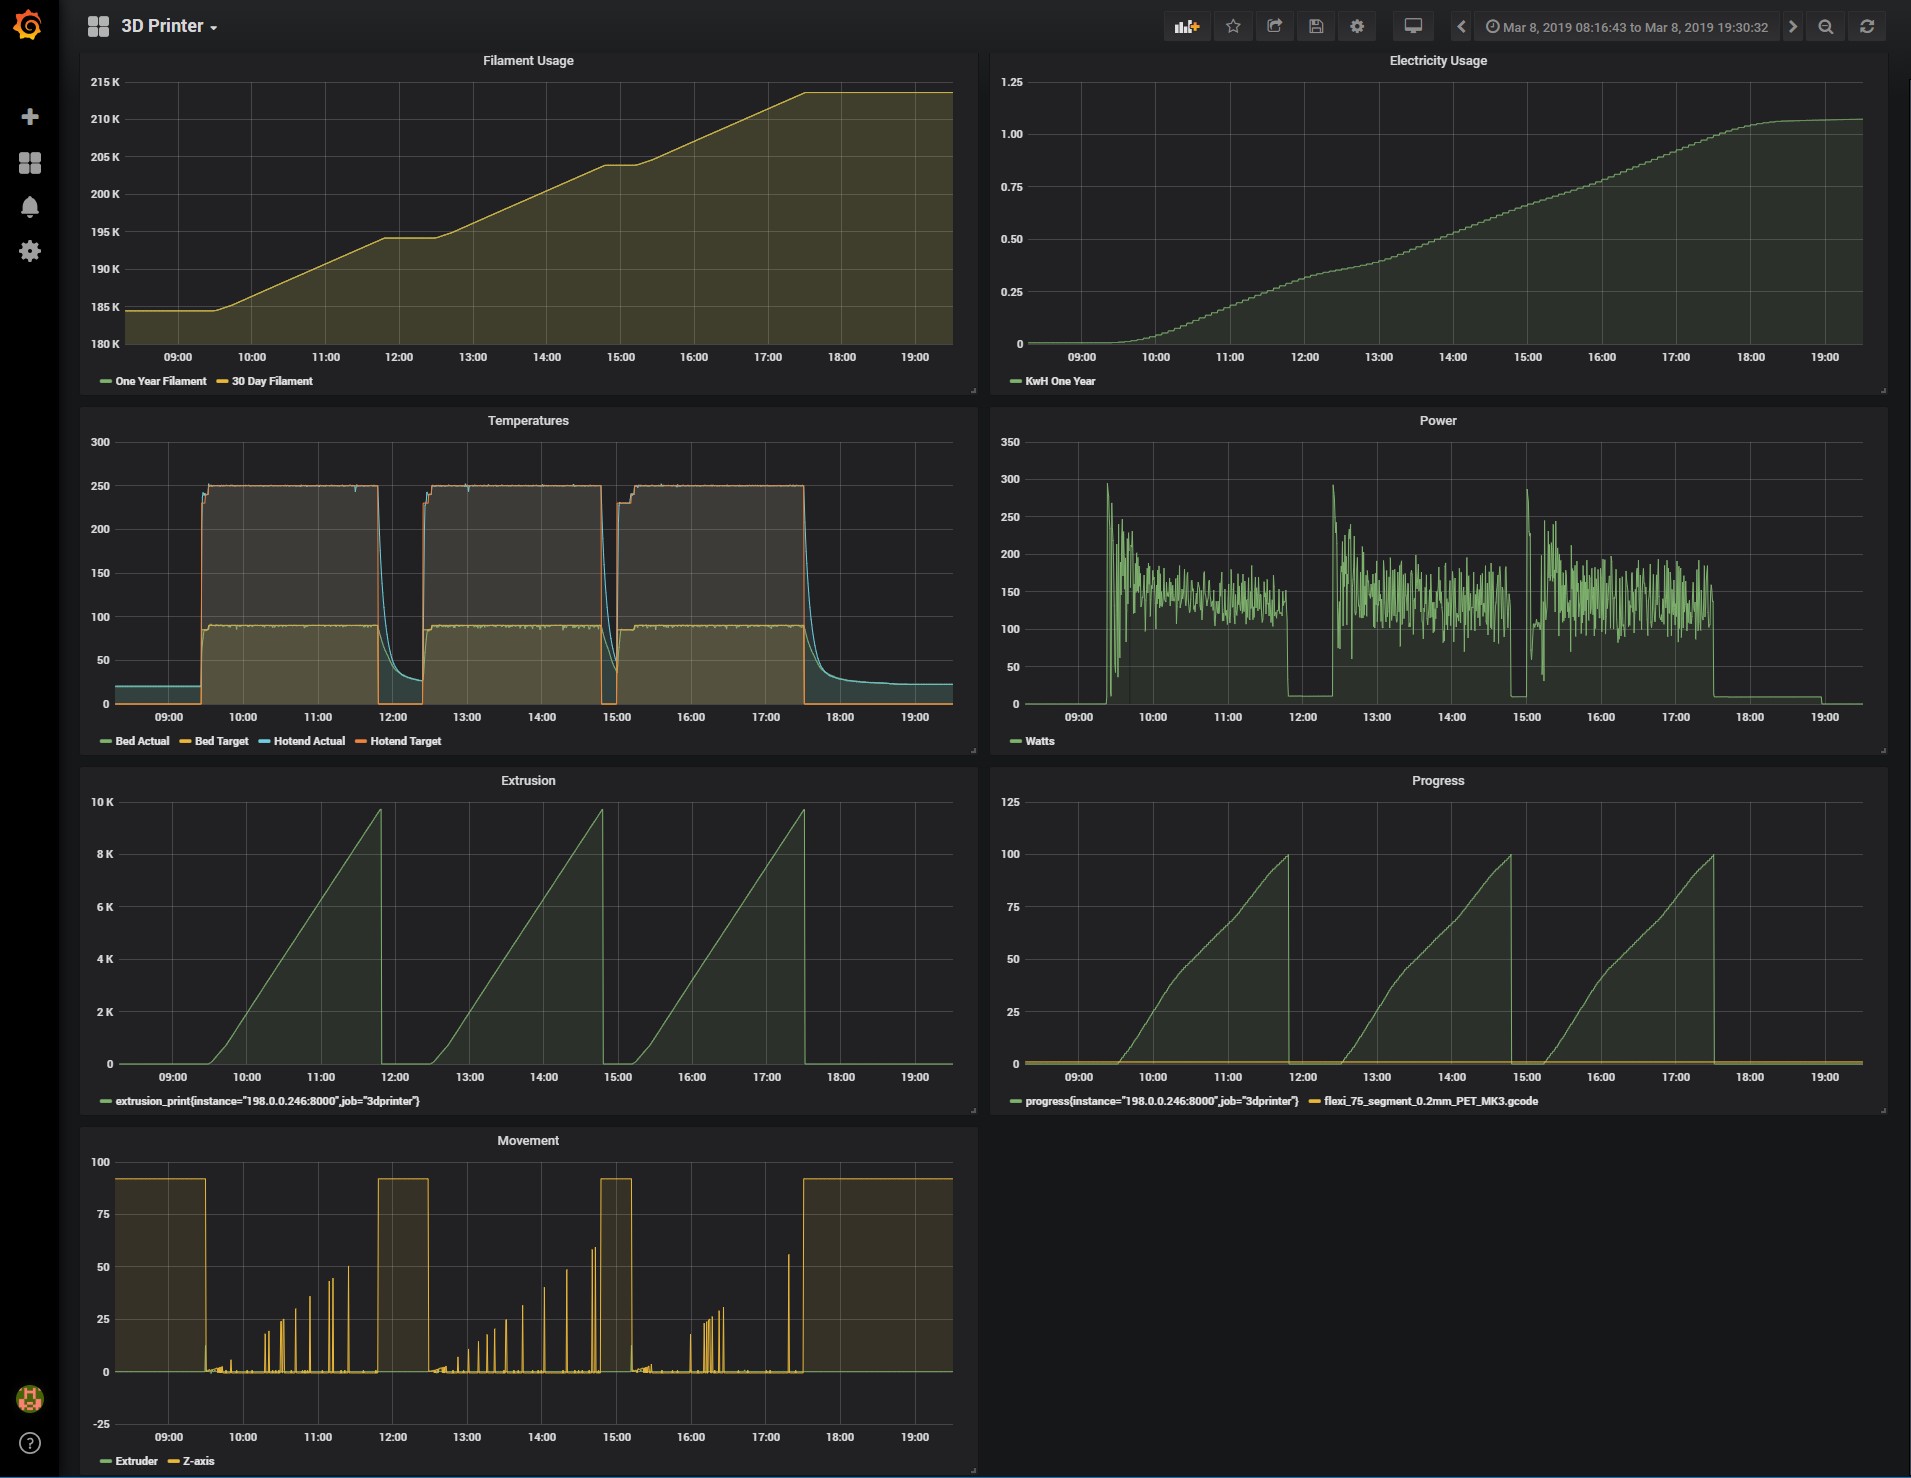
I think the best way to illustrate how this works is with an example from my prints yesterday (click the picture to get zoom in and get a decent view):
The first two graphs, “Filament Usage” and “Energy Usage” are cumulative and monotonically increasing. Filament usage is the total filament used by the printer. Every time I print, more filament gets used. Energy usage is the kilowatt-hours used by the printer.
The next two graph, “Temperatures” is the temperatures of the printer during the print. You can see I printed three things. If I was to zoom in the Grafana UI, you’d be able to see that for each print, first the “set” temperature occurs and then the temeperature rises as the printer preheats. Then it goes through its first layer temperature, ups the temperature a bit for the remaining layers, then the set drops and the actual slowly cools back down to ambient. Both the heated bed and the extruder do this. An interesting thing, if you look close enough is that there are a couple of 10C dropouts during the first and second prints. Printer firmware bug? Who knows. Needs investigation.
Next is the “Power” graph. Power is the instantaneous version of the data that went into the KwH graph. You can see that there’s a lot of power usage during the preheat phase, and then it bounces up and down as heaters turn on and off for the rest of the print.
The next row has “Extrusion” and “Progress”. “Extrusion” is a per-print version of the “Filament usage” graph and shows the amount of filament extruded for each print. Progress is goes from 0% to 100% for each print. Also in the progress graph is a string that identifies what model is printing. I printed “flexi_75_segment’ three times (all three prints were the same model).
Below that is the “Movement” graph. It’s a big of a work-in-progress because it’s yielding kinda strange data, so I’m probably not extracting what I expected to. The idea is to monitor the X, Y, Z, and E axis.
Tools used
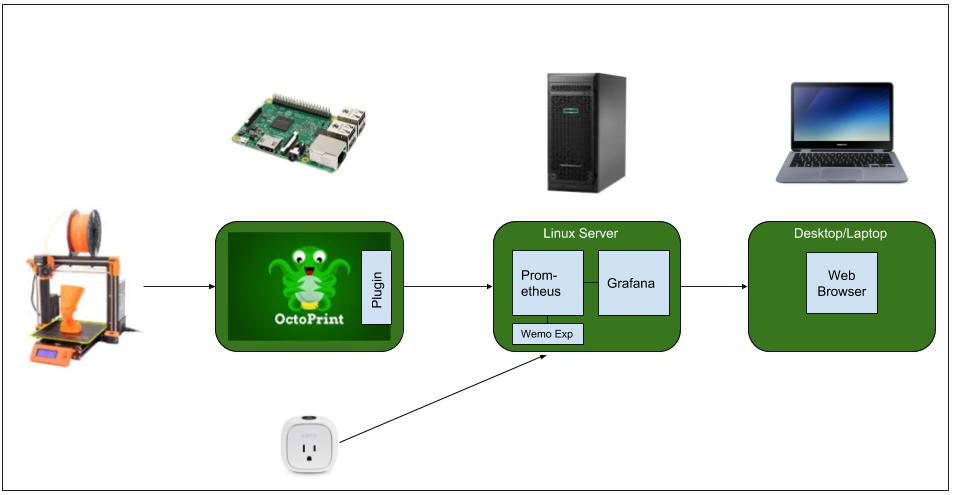
The workhorse of this is a couple opensource tools called Prometheus and Grafana. Prometheus is a time-series database and Grafana is a GUI. Of course. Here’s a a diagram of how it all fits together:
On the left we have the 3D printer, in my case a Prusa I3 Mk3.
In case you’re unfamiliar, OctoPrint is a raspberry pi based control system for 3D printers. It’s immensely popular in the 3D printing community and has a robust plugin framework. I wrote a Prometheus plugin for Octoprint that exports data in a way that Prometheus expects to find it.
Next we have a server running the Prometheus+Grafana toolset. You could possibly run this on another pi, but I think it makes sense to have a bit more horsepower. In my case I’m using a virtual machine running on a Linux box at my house. Prometheus and Grafana are run in containers on this machine, using the Helm+Kubernetes toolset.
On the far right we have the web browser, which is where the end user views the Grafana interface.
Finally, I’m using a Belkin Wemo Insight for power consumption monitoring. The Wemo Insight is a home automation device. It’s primary use is to turn things on and off, like lights or appliances, from your smartphone. However, it also offers power monitoring capability and for < $40, this seems like a bargain. The Wemo is of course optional, you can have the rest of the monitoring infrastructure without it.
Software
The following repos may be helpful:
- https://github.com/sbelectronics/octoprint-prometheus. This is where my Octoprint-Prometheus plugin is located. There’s a README with some setup instructions.
- https://github.com/sbelectronics/smbaker-infrastructure. These are my helm charts that I use to setup my monitoring machine. The helm charts are highly customized to my home office and include environmental monitoring, server monitoring, 3d printer monitoring, and power monitoring. You probably cannot use them as-is, but there might be useful tidbits that can be extracted out of them.

